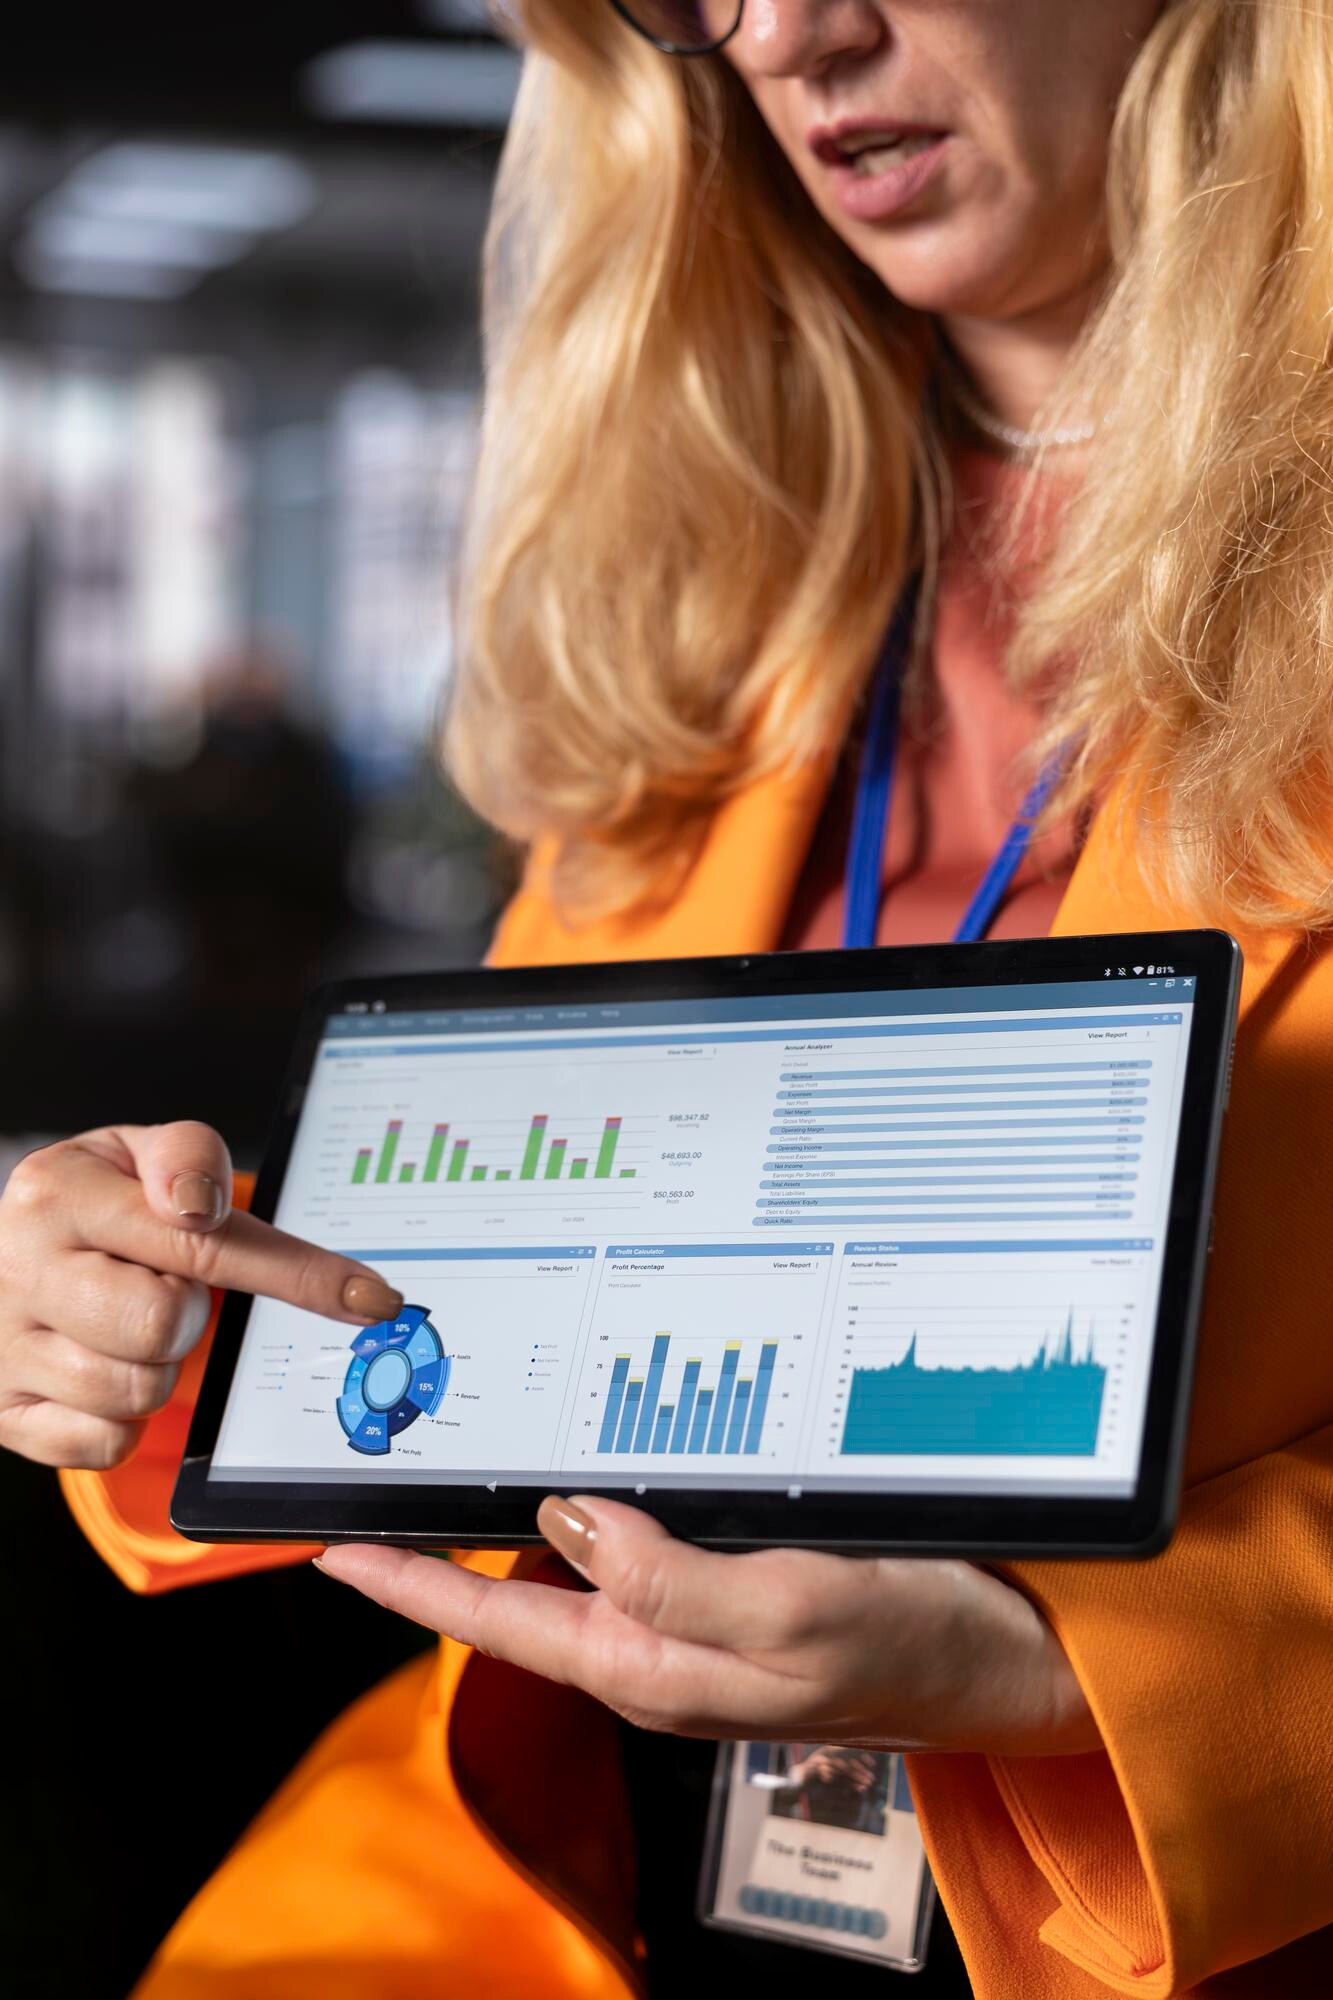
brand
brand
brand
brand
brand
brand

Unlock the Power
of Your Data

Transform complex information into clear, actionable insights with dynamic Business Intelligence Dashboards.

See Your Business Clearly. Act Smarter, Faster.
Mastering Your Data

The Power of Business Intelligence Dashboard

This is a technology-driven process designed to analyze data and present that information in an actionable format. It helps everyone from executives to front-line staff make well-informed business decisions quickly and confidently.

Business Intelligence Dashboards are interactive visual displays of key performance indicators (KPIs) and metrics, providing a real-time snapshot of your business's health. They are your customized, dynamic control panel for data.

Get Started

Why are they Essential?

It suggests that your design is innovative and forward-thinking, positioning it as a leader in the industry.

Visual Storytelling

Transform complex data into easy-to-understand visuals like charts, graphs, and gauges, making insights instantly clear and digestible for anyone.

Real-time Insights

Monitor performance as it happens, allowing you to react swiftly to changes and seize opportunities without delay. No more waiting for end-of-month reports.

Faster Decision-Making

Quickly identify trends, pinpoint opportunities, and spot potential problems, enabling you to make agile, informed decisions that drive your business forward.

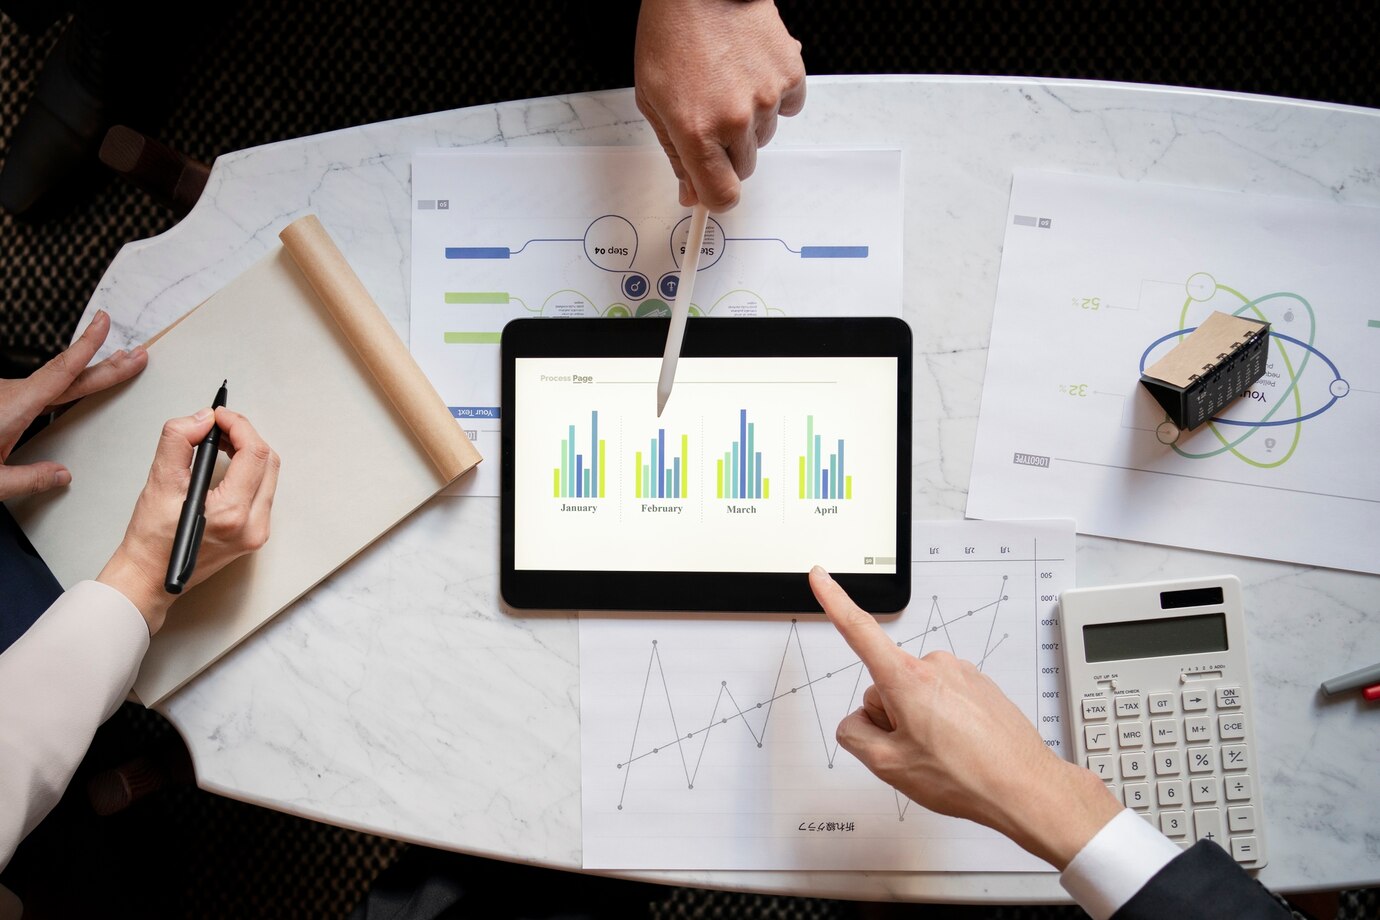
Improved Collaboration

Provide a single, consistent source of truth for all stakeholders. This fosters better alignment, communication, and shared understanding across all teams.

Enhanced Performance

Optimize operations, identify areas for improvement, and precisely track progress against your strategic goals and objectives.

Accountability

Clearly visualize individual and team performance against set targets, promoting ownership and responsibility within your organization.

Planing

Transforming Data into Actionable Insights

See Your Business Clearly

Transform raw data into strategic advantage. It provide a unified view of your key performance indicators, empowering teams of any size to make smarter decisions, faster.

icon
Keep everyone aligned with a shared understanding of performance and trends.
icon
Leverage the power of automated data processing to identify opportunities and potential issues.
icon
Equip every team member with the information they need to contribute effectively.

Visualize Success with Dashboards

An all-in-one analytics platform that empowers you to understand your business performance at a glance, ensuring you can proactively respond to trends and optimize your strategies.

icon
Engage with your data through dynamic charts and graphs that bring insights to life.
icon
Embed key reports and analysis directly within your workflows for immediate context.
icon
Quickly drill down into data and find the information you need without complex navigation.

Unlock Data-Driven Growth with Advanced Analytics

Measure what truly matters with the user-friendly dashboards and reporting tools. Filter, export, and drill down on your data in just a few clicks to uncover valuable insights.

icon
Quickly analyze your data with intuitive filtering, sorting, and drill-down functionalities.
icon
Save, schedule, and automatically receive reports directly in your inbox, keeping you informed without manual effort.
icon
Integrate with data sources and business applications you already rely on.

Unlock Insight now. Discover the Right Dashboard for Your Team

We are here to help you, contact us.